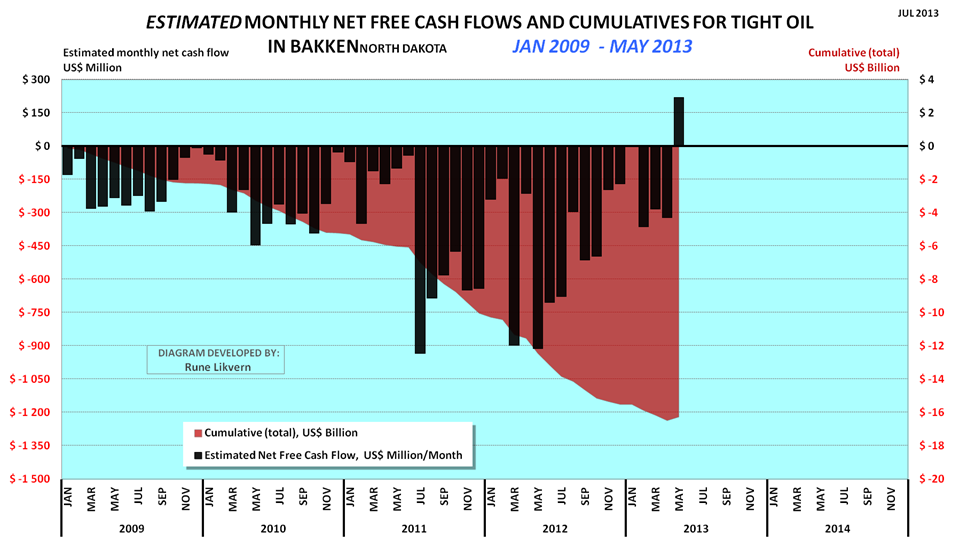
Le graphique du haut, je le comprends comme ça : le bilan est négatif (en terme d'argent : les investissements sont plus élevés que les retours) de janvier 2009 à mai 2013. Maintenant y'a quand-même un mois où ça a rapporté 150 millions de dollars.
L'article qui va avec l'article résume ça dans ce sens :
Estimates do not include any effects from hedging, dividend payouts, retained earnings and income from natural gas/NGPL sales (which now and on average grosses around $3/Bbl).
Estimates do not include investments in processing/transport facilities and other externalities like road upkeep etc.
As from January 2009 and through May 2013 an estimated $17-$20 billion is literally present as “capital in the ground”. There are now good reasons to believe that all this capital will be recovered and the investments will provide acceptable overall profits.
Je pige pas vraiment. Si quelqu'un peut expliquer en langage adapté aux gens allergiques au vocabulaire économique, je veux bien, parce que je vois pas comment on est censé déduire de ce graphique que la compagnie pétrolière qui gère ce truc va rentrer dans ses frais.
Sinon :
The chart may however raise questions about how much additional debt the companies are willing and/or capable to take on, and the prospects for continued debt access. Companies are normally aware that at some level their debt overhang could expose them to liquidity crunches in periods with lasting lowered oil prices.
Ca ça parait plus parlant : s'il faut s'endetter d'un milliard avant que le champ commence à rapporter de la thune, c'est pas vraiment pépère.


 Quand on a un javelin dans la main, tous les problèmes ressemblent à un T-72.


